Projects
Preparing Open Satellite Imagery for Disaster Mapping
A small workflow for turning earthquake-response satellite imagery into map-ready raster tiles.
Starting Point
After the February 2023 earthquakes in Türkiye and Syria, the Maxar Open Data Program released high-resolution satellite imagery to support humanitarian response and recovery.
Making imagery available is only one part of making it usable. The released data consisted of many raster files covering different areas. To inspect it in a familiar web map, I needed to select, download, combine, translate, and tile the source imagery.
What I Wanted to Try
How quickly could I turn openly released disaster imagery into a map-ready form using a small, understandable set of command-line steps?
This was less an attempt to interpret earthquake damage than an exercise in understanding the path between a satellite data release and a browser-based map.
What I Built
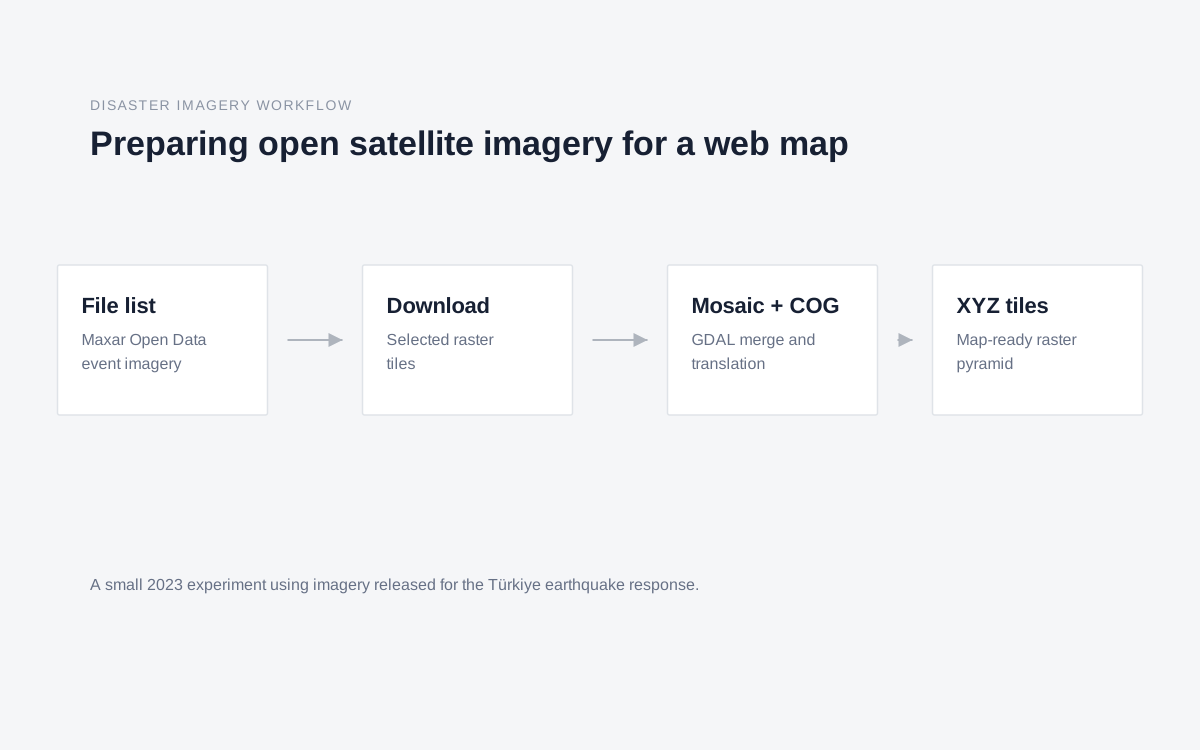
I made a small shell and GDAL workflow around the file list published for the event. It downloads the selected raster files, merges them into one mosaic, translates the result into a Cloud Optimized GeoTIFF, and generates an XYZ raster tile pyramid.
The main steps were:
- Download source files listed for the Maxar Open Data event
- Merge the rasters into a single GeoTIFF with GDAL
- Translate the mosaic into a tiled, cloud-optimized representation
- Generate XYZ tiles across zoom levels for use in a web map
What I Found Interesting
An open dataset can still be difficult to approach. File organization, spatial coverage, raster size, projections, and delivery formats all shape how quickly someone can begin looking at an event.
The exercise made the data-preparation layer more visible to me, but it also changed the question. The challenge was not only how to make large imagery files render in a browser. It was how to preserve enough context for someone to understand what the resulting map actually represents: which acquisitions were selected, when they were captured, what area they cover, how they were transformed, and what comparisons they can support.
A map that appears simple in the browser depends on many prior choices about selection, resolution, tiling, and storage. If those choices disappear during processing, the interface may make imagery easier to view while making its evidential limits harder to see. The useful translation layer therefore begins before the UI: it must carry source, time, coverage, processing history, and uncertainty forward with the pixels.
What It Does Not Do Yet
This repository is a compact record of commands rather than a complete or maintained application. It does not provide a user interface, automate discovery of new events, compare before-and-after imagery, or include a method for damage assessment.
It also generates a conventional raster tile pyramid, which duplicates data across zoom levels and is awkward to distribute compared with more recent cloud-native approaches. The workflow does not preserve a detailed record of why particular source files were selected.
Data and Attribution
This experiment used imagery from the Maxar Open Data Program released for the 2023 Türkiye earthquake response. Maxar Open Data Program imagery is provided under the Creative Commons Attribution-NonCommercial 4.0 license. The source imagery was downloaded, mosaicked, translated, and tiled for this experiment. No Maxar imagery is reproduced on this page.